At first glance, many folks don’t realize the leverage in using an Application Performance Monitoring (APM) tool like Application Insights. Yes, you can funnel logs to it so that you can search on them later. Yes, it will give you performance indicators on slowest API calls and slowest queries. Many of these platforms will. But if we take it a step further and we embrace these tools, we can make our lives much easier.
The basics
Yes, if you configure your favorite logger to send logs to Application Insights you will be able to search them later. This is assuming that adaptive sampling is not kicking on due to a large number of log events.
There’s also availability tests that are similar to products like Pingdom so that you are notified when your application fails a ping from one or more various regions around the world.
Taking it further
I really enjoy sending custom events to Application Insights. Assuming you’re willing to embrace Application Insights and take a direct dependency on the TelemetryTracker, you will be able to write creative queries later when you’re troubleshooting something.
For example:
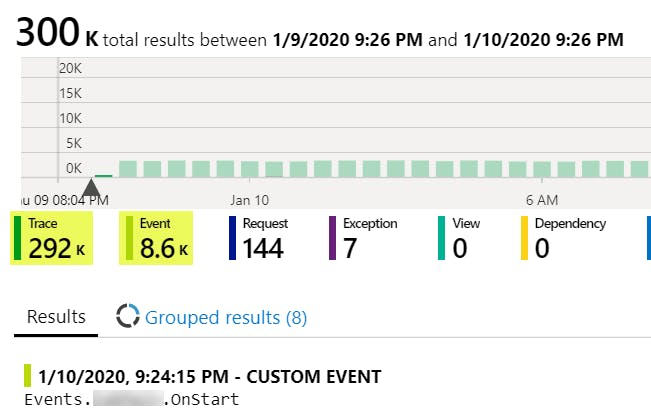
I recently was moving a set of background jobs to Azure Web Jobs using timers. Because Azure Web Jobs have lesser tooling than Azure Functions/Logic Apps, it was hard to see when jobs were being triggered. So to troubleshoot the execution of these scheduled jobs, I added custom events to show when a job was triggered. Because these jobs were being kicked fairly frequently (every few seconds), if I simply logged when a job was triggered it would have polluted the logs.
In the end, we have the information needed to troubleshoot and correlate when a job was scheduled and also continue to search through the logs.

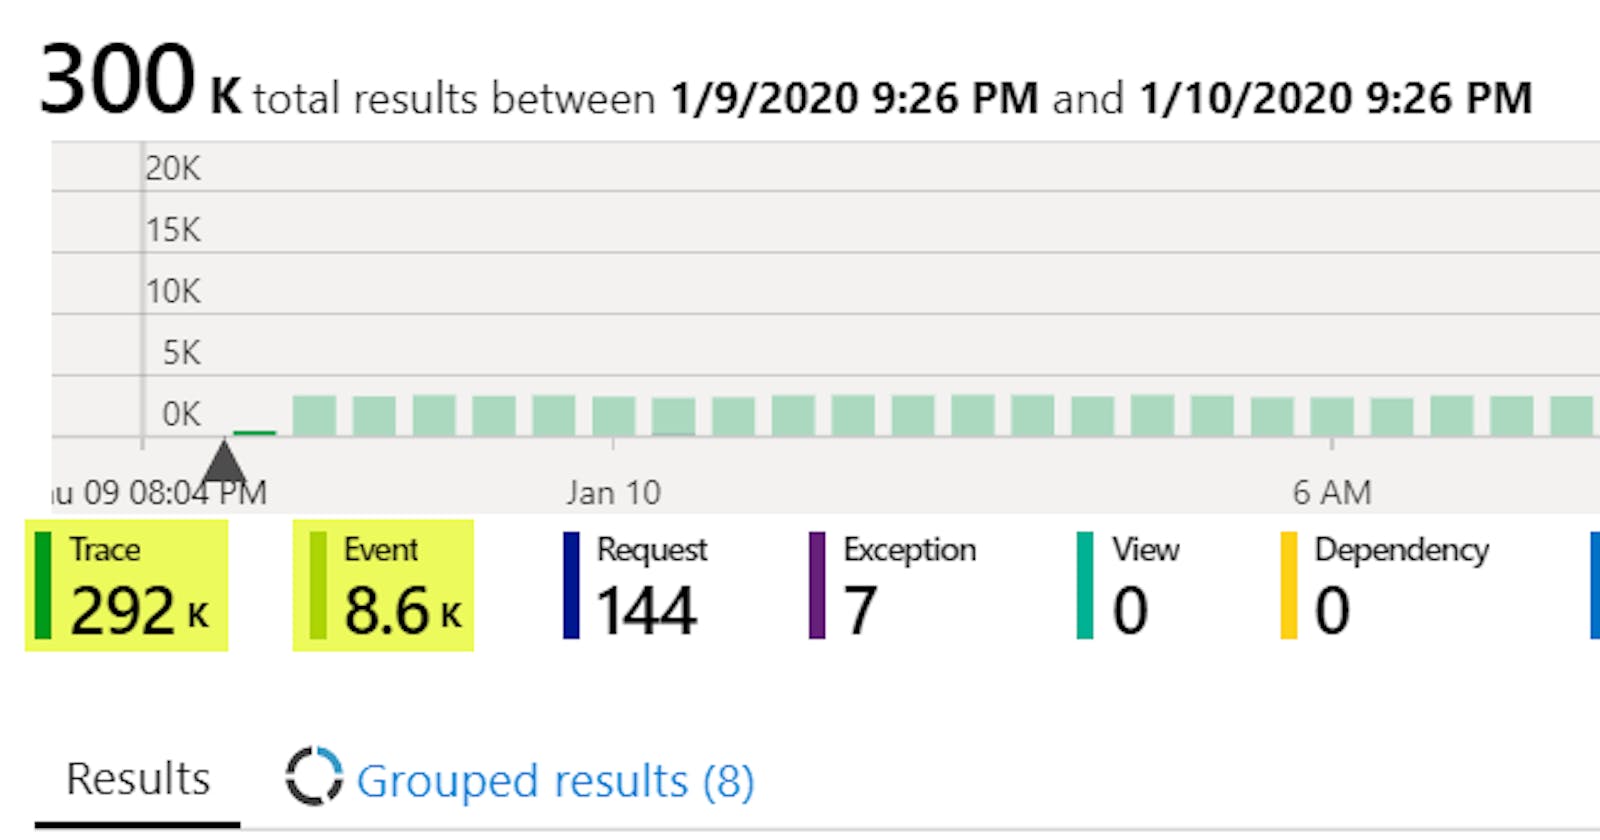
Note: In most cases, log data will be shown as Trace and custom events as Events.
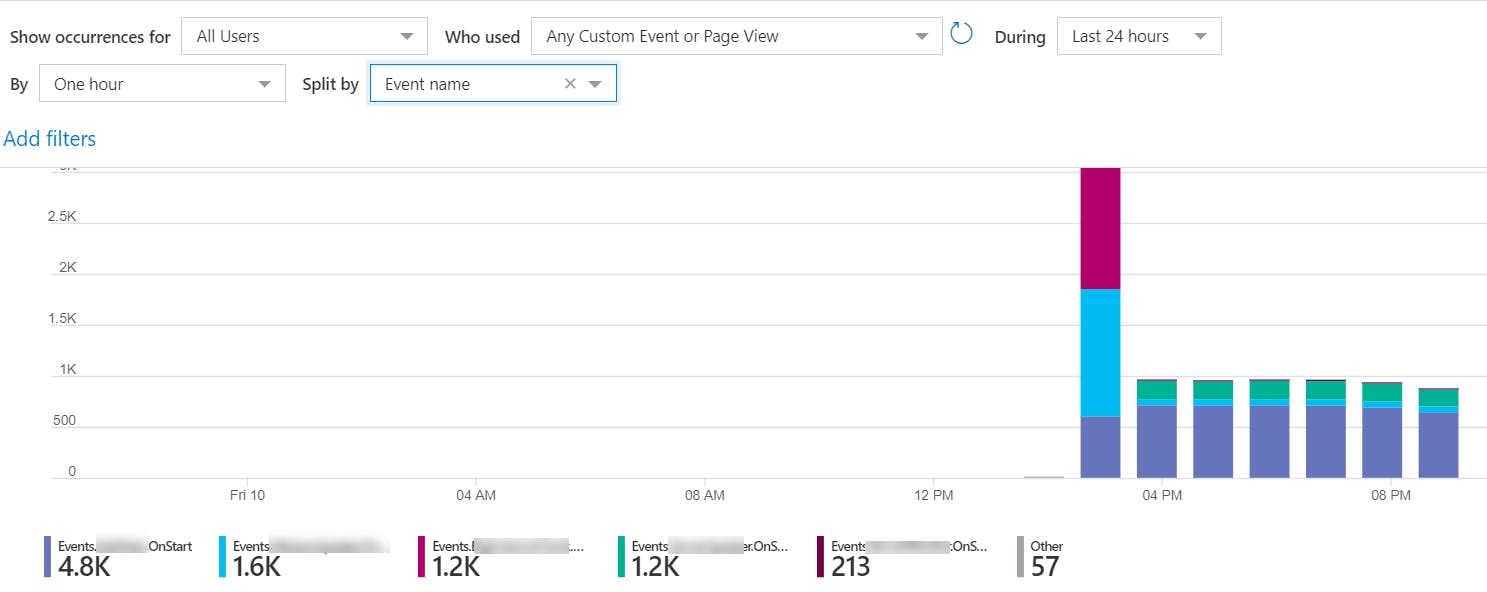
Then, there’s also the Events blade.

From here, you can see the distribution of custom events. If your custom events also have dimensions like properties or metrics to them, then you will also be able to split by your custom dimensions.

Note: In the example above, these events have no dimensions. But now let me confuse you some by adding some dimensions to the events:
TelemetryClient.TrackEvent("UserCheckedOut", new Dictionary<string, string>()
  {
      { "PaymentType", "PayPal" }
  });
I don’t have a pretty chart screenshot. But, from the Events explorer you would be able to see all the UserCheckedOut events over time. Also, you would be able to see a breakdown of the percentage of payment types are PayPal vs the others.
So what
Have you wondered…
Are there any types of payment that tend to be more problematic?
Are there certain customers who seem to experience more issues?
What percentage of partners use certain features?
Or have you generally wondered how your system is truly being used? Have you found the need to correlate system events to business events to validate your theories? Then take some time to look at custom events.

